Other Charts
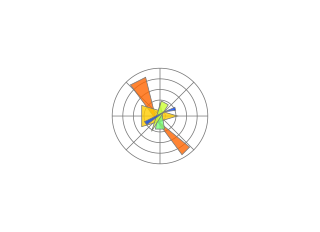
Additional Python charting options in Reflex, including Plotly and Matplotlib (pyplot). Render interactive Plotly Express figures and any Matplotlib plot in your web app — all in pure Python.
Choosing a charting library
- Recharts (built in): declarative charts with a simple API for standard business charts like bar, line, area, and pie. Good for dashboards and reports.
- Plotly (
rx.plotly): interactive scientific charts with zoom, pan, and hover, including 3D plots, contours, and statistical charts. - Matplotlib (
pyplot): render anymatplotlib.pyplotfigure as a static image. Best when you already have Matplotlib code from notebooks or scripts. - AG Charts (enterprise): high-performance charts with animations and advanced features. See the AG Charts docs for examples.